Have you heard of Pinterest’s web analytics tool?
Last week Pinterest launched its new web analytics tool which makes it easy for you to track pins and repins from your website. This tool is a great addition as you can now study the most popular images on your website and use the information to drive more engagement and traffic. Below I have written steps on how to get started with Pinterest’s free web analytics tool, what everything means and how you can use it to promote your business…
How to view analytics…
1. Verify your website:

If you want Pinterest to display your website data you need to verify your website first. Usually the website is displayed with a globe sign on your profile, but when you verify it the whole URL along with a tick mark appears on the profile just like in the above image. You can only view the data if your website has been verified. If you haven’t verified it, please do so – I have shown you how to perform this step in this post (it’s the second point) or you can also watch our Free Pinterest Marketing Video Tutorial where I have explained it in more detail along with several other marketing tips.
2. Switch to the new Look:
After you verify your website you need to switch to the new look. The new look is something Pinterest are working on. It’s got bigger pins and is a little different. Don’t worry if you don’t like it, you can always switch back to the old one.
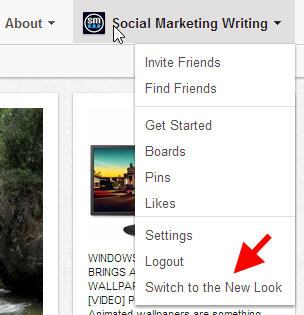
To switch to the new look hover over your business/profile name on the top right corner – wait for the drop-down menu that appears – and click on ‘Switch to the New Look’.
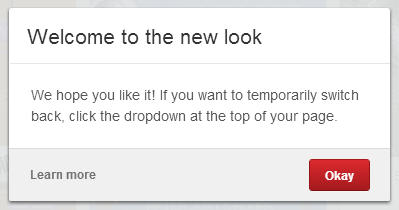
You will then get a message welcoming you to the new look and it also lets you know that you can always switch back to the old look. So read the message and click on the red ‘Okay’ button.
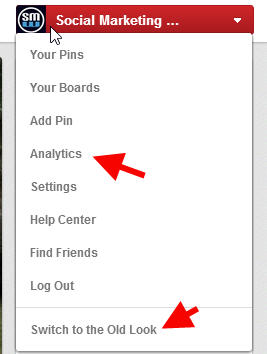
Once that’s done scroll over your business name on the top right corner again and click on ‘Analytics’ which appears on the drop down menu. This will take you to the analytics page where you can view your data. You will also notice the ‘Switch to the Old Look’ button on the menu. After you check your analytics you can switch back to the old look if you are not happy with the new one.
View and study your analytics…
3. Analytics:
On the analytics page the first tab shows you the ‘Site Metrics’
Under site metrics you can view a whole lot of data on the way the images on your site are performing on Pinterest. Below is an example of how the site metrics graphs look.
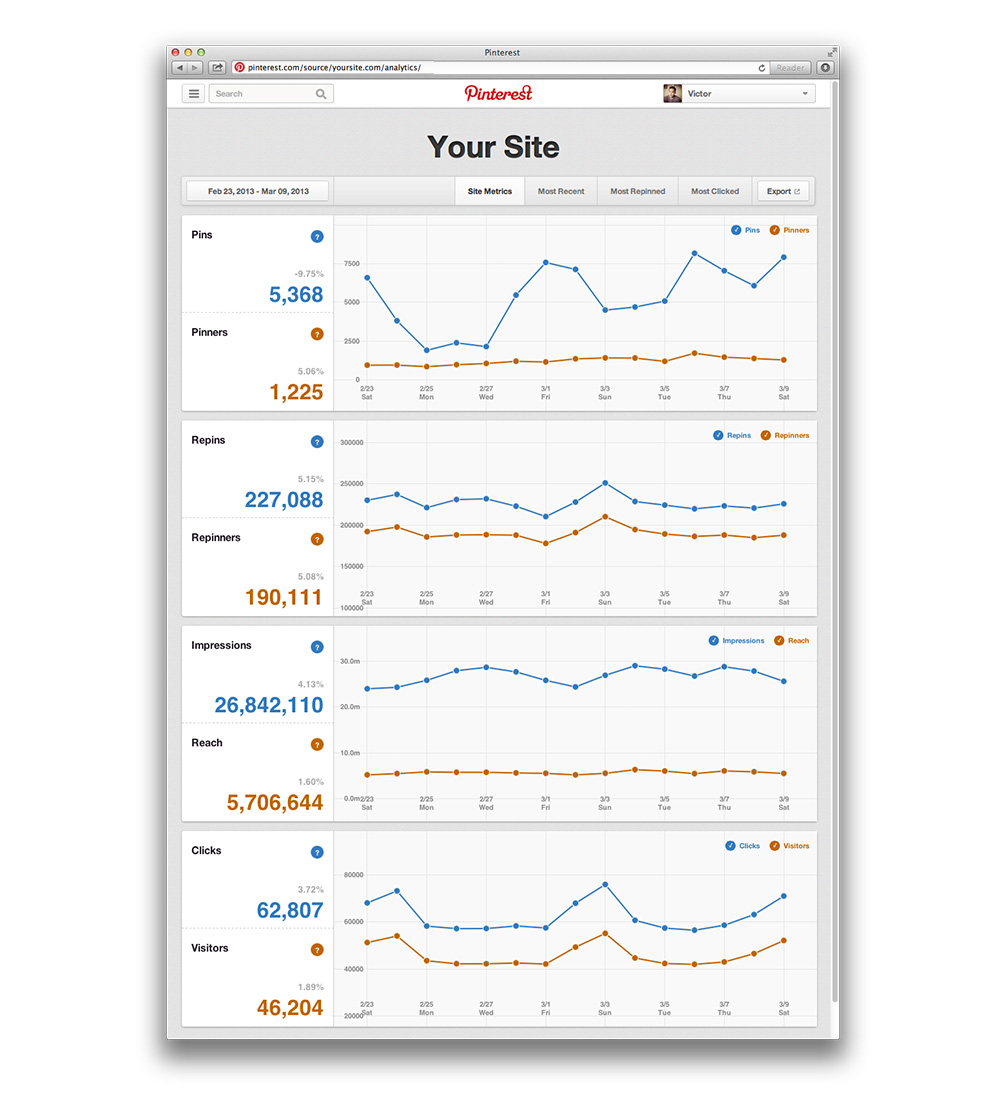
As you can see there are four graphs here.
The first graph displays the number of images being pinned from your website everyday and the number of users who have pinned them. Go through the graph and look for days on which your website received more pins. You can then find out what you did right on that day – maybe you published an image, maybe you get more pins on that specific day of the week, etc. – and then use it to your advantage to get more people to pin images from your website.
The second graph shows the number of Repins and Repinners. This is the number of times the pins have been repinned and the number of users who have repinned them.
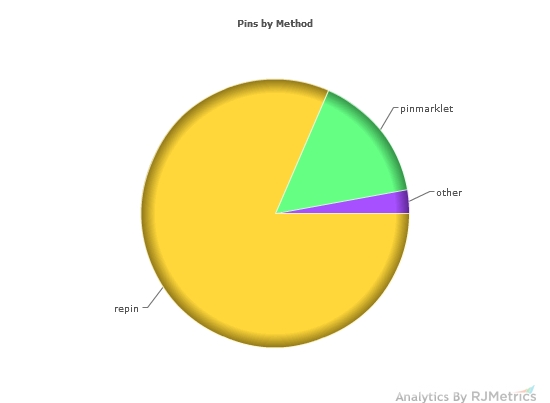
Repins are an important metric to make note of too, maybe more important than pins as 80% of the pins on Pinterest are actually repins. So carefully study the graph and check which days you are receiving the most repins on and what you are doing right on those days and focus on doing more of the same.
The third graph shows the number of impressions and reach. Impressions are the number of times the pins have appeared on Pinterest; on the main pages, in search results, feeds or on boards. Reach is the metric that displays the number of people who have seen your pins. This is again a great way to check which days are working well for you. You could also calculate your reach against the number of pins and repins to check how effective they have been and if the effort you are putting in is getting you more exposure.
The fourth graph shows the number of clicks to your website that came from Pinterest and the number of people who visited your website from Pinterest. Again this metric can be compared with the other results to check if the pins and repins are getting you enough clicks and visitors. If you are getting lots of pins and repins and not getting traffic as your images are meant for building a brand image by themselves then you could be happy with the results. But if you aren’t getting enough visitors and receiving traffic through Pinterest is an important factor you might need to work on your pins to get more people to click on them.
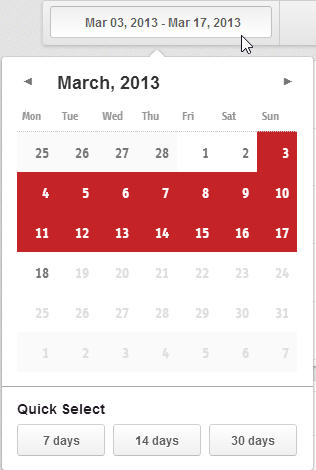
You can choose the different dates and periods to analyze data on the top left corner.
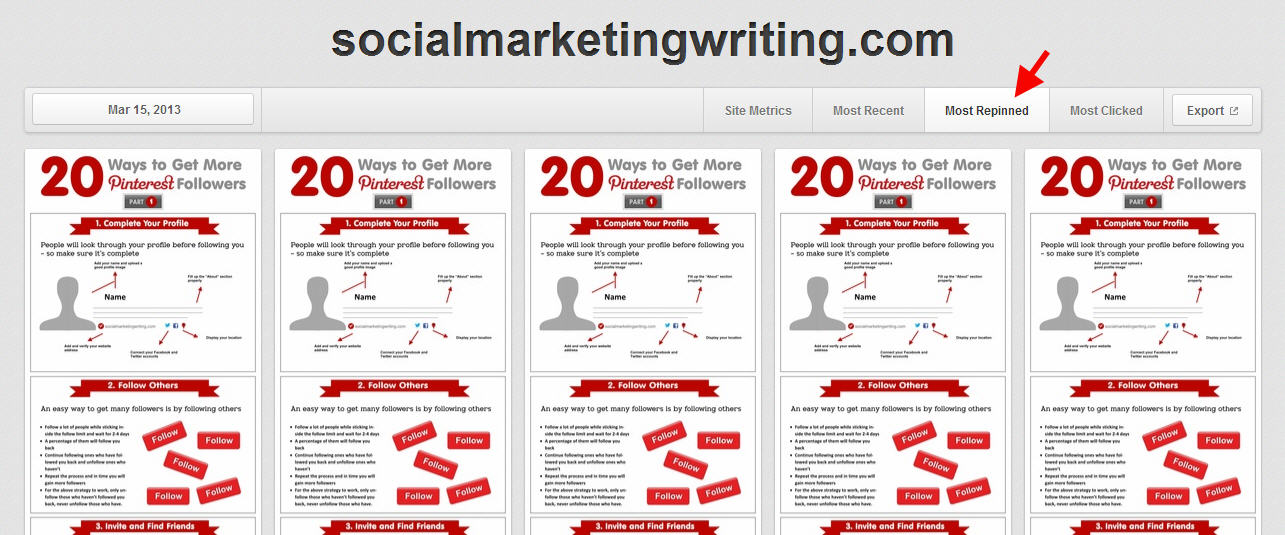
If you want to go into more detail on which images/pins are doing well you can check the most clicked on and the most repined pins.This way you can find out what the most effective images are and create similar ones for your website. You can also check the most recent pins from your website which is the same result you get when you use the link http://pinterest.com/source/youromainname.com/ (type your domain name where it says yourdomainname). You will also be able to see who is pinning these images.
All this data is downloadable.
Although it’s a basic analytical tool, it is still very useful and if implemented the right way you can get more pins and repins & drive more traffic and engagement. If you want a better tool which also display brand page analytics, you could try out a software like Curalate, but if it’s not in your budget you can continue using the free tool and switch to a better analytics tool when you need one or have the budget.
For more Pinterest tips Sign up for our blog updates and get the Free Pinterest Marketing Video Tutorial.
Have you used the new Pinterest web analytics tool? What do you think about it? Have you got any tips you would like to share with us? I would love to hear your thoughts.
Would you like to create a Pinterest marketing strategy and use it set up the perfect page and get yourself followers, repins, traffic and sales? Then get The Complete Pinterest Marketing Bundle…

