The content marketing landscape is constantly evolving. Today, it’s not just about writing blog posts and hoping to attract traffic. With the emergence of more engaging formats, marketers can come up with creative new ways to present information.
One such content marketing tool that has grown to become a favorite is the infographic. The reasons behind its popularity can be attributed to its engaging format and the ability to present complex information in an easy-to-digest manner.
From creating brand awareness and boosting credibility to driving traffic to your website and improving search engine rankings — infographics can help you achieve all this and more.
As per a recent study, 40 percent marketers agreed that infographics were the best-performing content in 2019. And with the rise of remote work and decreased budgets, marketers are looking for low-cost options to reach new audiences.
In this article, you’ll find out more about how to create viral infographics that drive backlinks and press mentions.
How to Create Infographics
Creating content that goes viral is what every marketers’ dream is made of. Social media infographics can help you achieve that.
So, let’s take a look at how you can create infographics that can be published on social media to reach new audiences, increase visibility, drive backlinks and press mentions.
Identify the right topic
The first step to create viral content is choosing the right topic. If your topic isn’t enticing enough or relevant to your target audience, there’s no way it’s going to be shared.
Here are some points to keep in mind while brainstorming infographic topic ideas:
- Solve customers’ pain points, challenges or questions
- Entertain readers or satisfy their curiosity
- Bust common myths
- Challenge misconceptions
- Discover trending topics and create topical content
- Create a roundup of expert quotes or tips
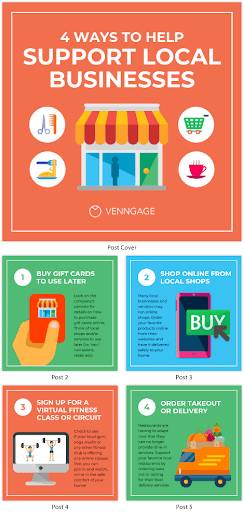
Make sure you keep the infographic focused on a specific topic, as that’s likely to keep your readers more interested and engaged. Here’s an example of an infographic that focuses on a single, specific topic — ways to support local businesses.
Do keyword research
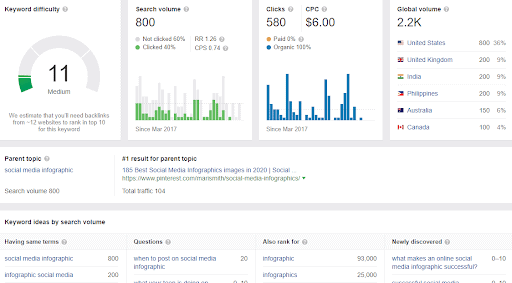
Once you have a broad idea of what your infographic will be about, you need to determine specific target keywords. You can use Google’s Keyword Planner or Ahrefs to find the right keyword to rank for.
Select long-tail keywords (phrases with three to four words) as they are more specific and low on competition.
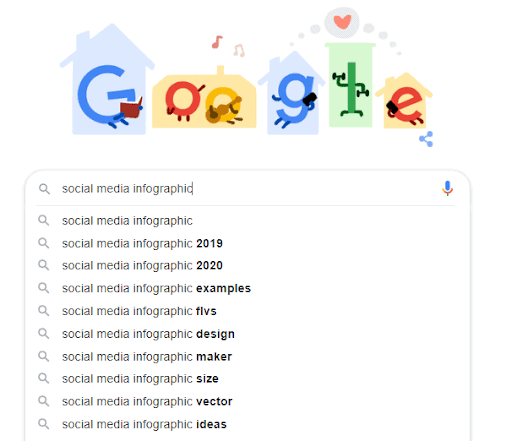
You can also get keyword ideas by leveraging Google’s autocomplete feature — this will give you an idea about the commonly asked search queries related to your topic.
After finding the keywords it is also important to follow their rankings with a ranking tool like Linkio which will help you with monitoring the positions and a lots of quality additions to your campaigns.
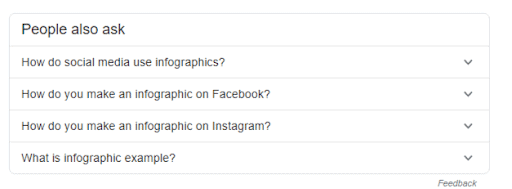
You can also find more ideas from the search results page by looking at the ‘people also ask’ and ‘related searches’ sections.

As infographics are images, the most effective way to optimize them to rank well is by using the target keyword in elements such as the title tag, meta-description, supporting content, web page URL, infographic image file name and alt text. More on SEO image optimization in this guide.
Build a wireframe
Establish the objective of your infographic — are you looking to educate readers, make comparisons, show changes or organize information? This will guide you in conducting your research and deciding the data points you plan to include.
The next step is doing research. If you’ve carried out a poll or survey, start organizing that data. If not, do your research and gather relevant data and statistics that could be included in the infographic.
Here are a few ways to collect data for your infographic:
- Do a targeted Google search by using quotes to search for an exact phrase (“remote working”), using the minus sign to eliminate certain words (content marketing-resume) or including the word ‘data’ to your search phrase.
- Browse existing data repositories (eg. The U.S. Government’s Open Data, Statista and Google Scholar to name a few).
Now that you’re sitting on a repository of data, create an outline (or wireframe). This is a crucial step and is meant to give the infographic a logical structure. Outline the various sections and make a note of the points you intend to add under each section.
Present information visually
Creating infographics boils down to presenting information in a visually appealing manner. Moreover, let’s not forget that you’re creating a social media infographic, which means it needs to have strong, eye-catching visuals.
From statistical, informational and timeline infographics to process, geographic, comparison and list — there are several different types of infographics. What’s important is assessing the type best suited to showcase your data. Let’s take a quick look at each of the types and their purposes:
- Statistical: present data, facts and statistics from multiple sources or backup an argument with relevant data
- Informational: communicate a new or specialized concept
- Timeline: highlight important dates or give an overview of events
- Process: provide an overview of the steps in a process
- Geographic: present location-based data, demographic data or compare data by region
- Comparison: compare two options
- List: to summarize information or present lists
Irrespective of the layout you use, be sure to maintain a sense of balance and structure, giving enough breathing space to enable readers to consume the information. Here’s an example of a clean and simple layout, with enough negative space between the design elements.
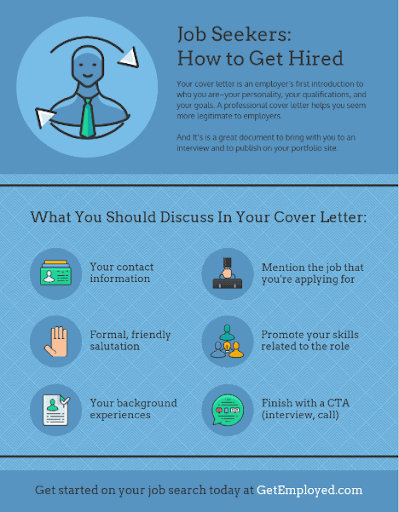
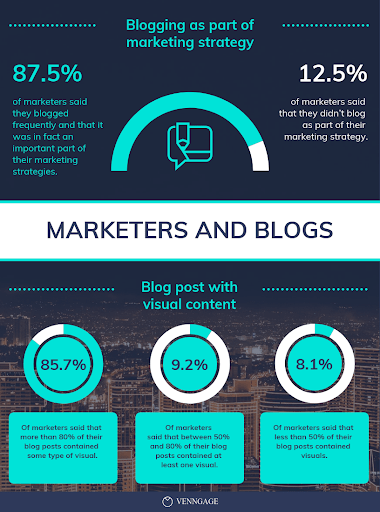
Apart from graphs and charts, also look at including images, symbols, bubble charts, icons or illustrations to make the infographic more engaging and memorable.
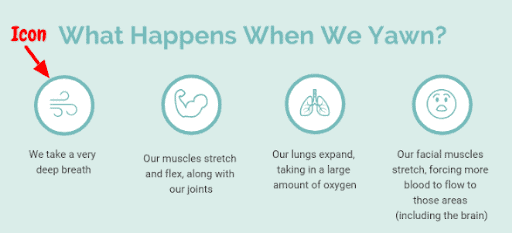
The key is to make it aesthetically pleasing while keeping text at a minimum.
No design experience? You can use an infographic maker and rely on templates and graphic design resources to give you a head start.
Clean and simple design
Design infographics so that they are clear and easy to understand. Messy and cluttered infographics with huge chunks of text, illegible fonts and no white space just spells trouble.
Here’s how you can maintain a clean and simple design:
- Select legible and readable fonts
- Stick to 2-3 contrasting colors
- Keep colors, sizes and styles consistent
- Use white space appropriately
- Establish visual hierarchy among design elements
How to Extend Your Social Media Reach and Engagement for Your Infographics?
You’ve created a stunning, value-packed infographic. Now, it’s time to promote it and get as many people to read and share it as possible.
Speaking of increasing reach, there’s no better medium to share content (with a hope to go viral) than social media.
Apart from the usual social media networks such as Facebook, Twitter, LinkedIn and Instagram, you should also share it on Pinterest which is known to be perfect for visual content.
Let’s take a look at how you can optimize infographics for social media to attract traffic to your website and drive backlinks and press mentions.
If you combine the below tactics with a good outreach strategy you will attract a lot of backlinks. So, make sure you be prepared with a press kit and email templates. You can learn how to create a press kit here.
Break down the infographic
Social media is not the place for text-heavy communication. What works here is short, snackable content.
While you can post a link to your infographic page and wait for people to click, a more effective way to grab attention is to break down the infographic into smaller sections and post them periodically to generate interest in your social media followers.
Here’s an example of how we repurposed our infographic on 61 Women In Tech Speak Up to several smaller social media posts, with a link to the complete infographic.
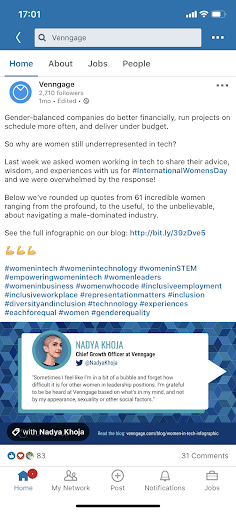
You can also leverage the carousel and multi-picture post features on Facebook, LinkedIn and Instagram to showcase multiple social media posts at once.
Post teasers
Want to get people intrigued and curious about your infographic? Post teasers. Not only are they social media friendly, they are also effective in driving traffic to your website.
Posting teasers on social media involves sharing certain sections of your infographic without giving it away entirely. The idea is to grab people’s attention and compel them to click on the infographic link.
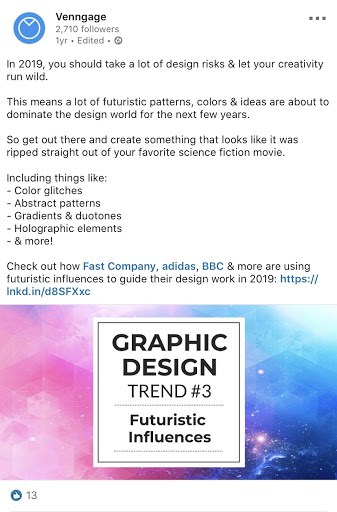
Here’s an example of a teaser we posted on social media encouraging people to check out our infographic on the biggest graphic design trends.
Strategically use the target keyword
Remember the target keyword you optimized the infographic content for? It’s time to use it on social media too.
Make sure you use it in the social media captions and pin descriptions. You should also coin relevant hashtags (containing the keyword) to increase exposure and make your content easily findable.
Use easy-to-read fonts
People are usually scrolling through multiple posts on social media. How do you ensure your social media infographic stands out and captivates them?
Font size, style and weight play a critical role in helping your content stand out. For instance, a font that looks pretty might not be the best choice for social media.
So, choose one that’s legible and enhances your message. Don’t use more than three fonts as that can look cluttered and won’t look professional on social media.
Optimize image sizes for different platforms
Using the same visual across all social media platforms is almost criminal. The last thing you want is having your audience zoom into an Instagram infographic to make sense of it or worse, having a section of the post being abruptly cropped out.
Every social media platform has different sizing specifications and requirements. In order to make social media infographics work for you, you must optimize them for the different platforms.
For instance, 1200 x 630 pixels work best for Facebook image posts. Similarly, the optimal image size on Instagram is 1080 x 1080 pixels. Wishpond lists all the current social media image size requirements.
So, optimize image sizes as per the post format and social media platform to maximize views and performance.
Include your brand logo
It’s always a good idea to include your logo in a social media infographic. That way when it gets shared, your brand gets due credit and visibility.
Regardless of where you choose to place it, make sure it’s subtle and doesn’t overpower the communication. You should also maintain consistency in all your social media posts to enforce brand recognition.
This will also help you improve your visual identity on social media and create a strong presence. It’s also important if you’re creating infographics as creatives for your affiliate marketing, in which case you’d want to include the affiliate’s branding too.

Add social sharing buttons
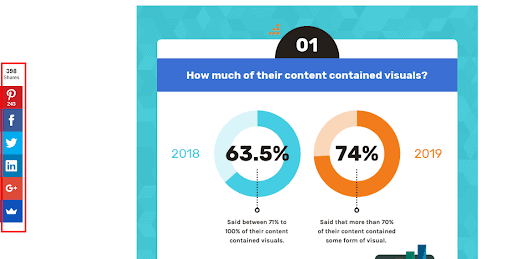
Apart from sharing infographic content pieces on your social media platforms, you’d also want readers to organically share it on their pages. So, why not make it easy for them to do so? You can use a tool such as AddThis to add social sharing buttons next to the infographic while publishing it on your blog or as a guest post.
This will encourage social sharing and enable people to share the infographic with their network with a click of a button.
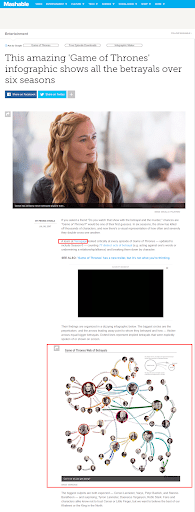
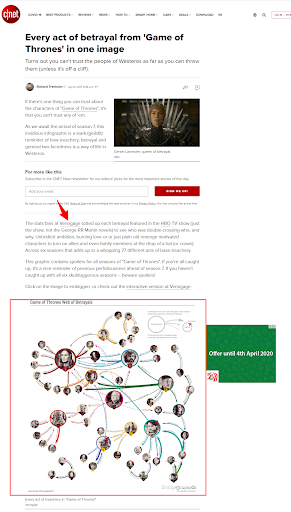
One of our most viral content pieces here at Venngage was our Every Betrayal Ever in Game of Thrones infographic. Leveraging the massive popularity of the show, we decided to design a mind map, illustrating all the betrayals that had occurred throughout all the seasons.
Conducting original research and then designing a compelling infographic with the perfect use of shapes, icons and simple, easy to read fonts made sure our infographic was hugely successful.
Not only did it go viral on social media, it also got us press mentions on leading websites such as Mashable, Popsugar, CNET, and Elite Daily, driving backlinks and website traffic.
The Takeaway:
With all the effort that goes into creating infographics, you must leverage them to attract traffic, boost awareness and establish credibility.
What’s important is designing a valuable and share-worthy infographic and aggressively promoting it through social media, guest blogging and outreach marketing.
While there is no fixed formula for creating a viral infographic, following these tips can increase your chances of creating an infographic that goes viral, while driving backlinks and press mentions.
If you’d rather hire an employee to create infographics, consider job aptitude tests.
About Bronwyn Kienapple
Bronwyn Kienapple is a Content Marketer at Venngage. Her writing has been published in Foundr, 99 Designs, Brit + Co, FreshBooks & more. She is a mother, feminist, world traveler and fan of Mexican street food. Find her on LinkedIn.
